Test files
"How to" Guide
- Quadrupole Orbitrap mass spectrometer set up for shotgun lipidomics
- Internal standard mix: UltimateSPLASH™ ONE (Avanti Polar; cat. Nr.330820L-1EA)
- Infusion spray solvent. We use the SprayMix: IPA/MeOH/CHCl3 4:2:1 v/v/v + 7.5 mM ammonium formate.
- Xcalibur software (Thermo Fisher Scientific; a version supplied with your instrument).
Suggested dilution for Q-Exactive Orbitrap. Adapt the dilution based on the performance of your instrument -
- Add 1 mL of SprayMix solvent to 10 µL of internal standard (UltimateSPLASH™ ONE)
- Further dilute 100-fold in the sample plate compatible with shotgun analyses with SprayMix. If you use syringe infusion with a higher (~ μL/min) flow rate you might want to adjust the dilution ratio such that the intensity of most abundant peaks in MS1 spectra is close to 1×10⁶ for positive and 1× 10⁵ for negative mode.
- Once the spray stabilises, acquire: MS1 positive for ca. 1 min; MS2 for ca. 30 sec; MS1 negative ca. 1 min and MS2 negative for ca. 30 sec. Altogether, it should be around 3 min; however, the exact timing is not required (See Fig.1 as example). Use profile mode for all spectra.
- Acquire MS positive within the mass range of m/z 150-1000; MS2 positive only for PC-d5 33:1 (m/z 751.6008); MS negative within the range m/z 150-1000; MS2 negative only for PE-d5 33:1 (m/z 707.5393). When calculating MS2 quality index we rely on monoisotopic peaks and (currently) neglect the first and second isotopes transmission because labs use different settings.
- When acquiring MS2 spectra, apply stepped NCE at 10% and 30%, ideally dividing the acquisition time equally between the two NCE. The merged MS2 spectra should contain both precursor and fragment ions – this is necessary to benchmark the collisional fragmentation efficacy as explained in Home page.
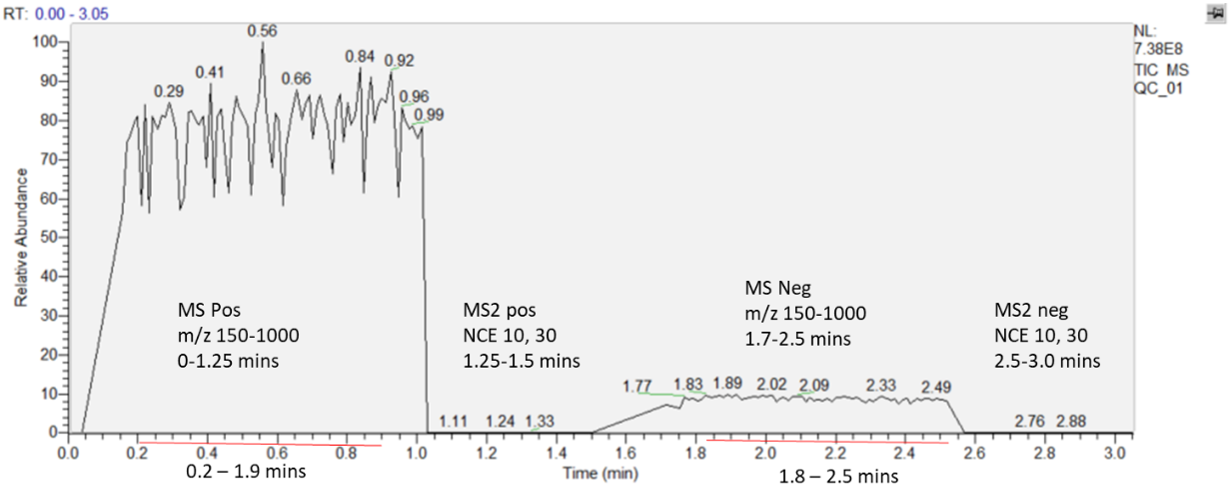 |
| Figure 1. The figure displays a representative spectrum collected in both positive and negative ion modes. Initially, the instrument acquires an unfragmented (full scan) spectrum followed by a targeted fragmentation event, applied within a specified m/z range and time window. An ideal TIC intensity should be around 1×10⁸ - 1×10⁹. |
- Open the acquired .raw file in Xcalibur software; it should look approximately like Figure 1.
- Enable the “Resolution” and “All peaks” at the Display Options panel of Xcalibur (Figure 2A).
- Select the ranges of stable spray for each mode (MS1 or MS2) and polarity (pos or neg); there should be four time ranges in total. It is not necessary to always select the same time range, but we recommend it should be about 1 min for each MS1 spectrum and, at least, 30 sec for MS2 spectra. The duration of time ranges should support representative averaging of peaks.
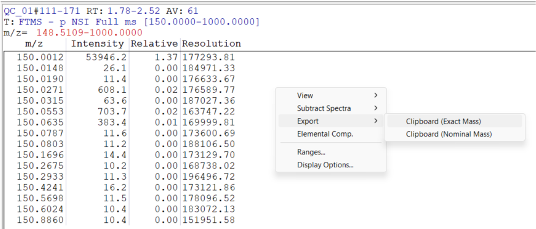
- Export peak lists annotated with m/z (Exact Mass), Intensity, and Resolution into the clipboard (Figure. 2B) and copy them into individual spreadsheets in the same Excel file. The order must reflect that shown in Figure. 2C.
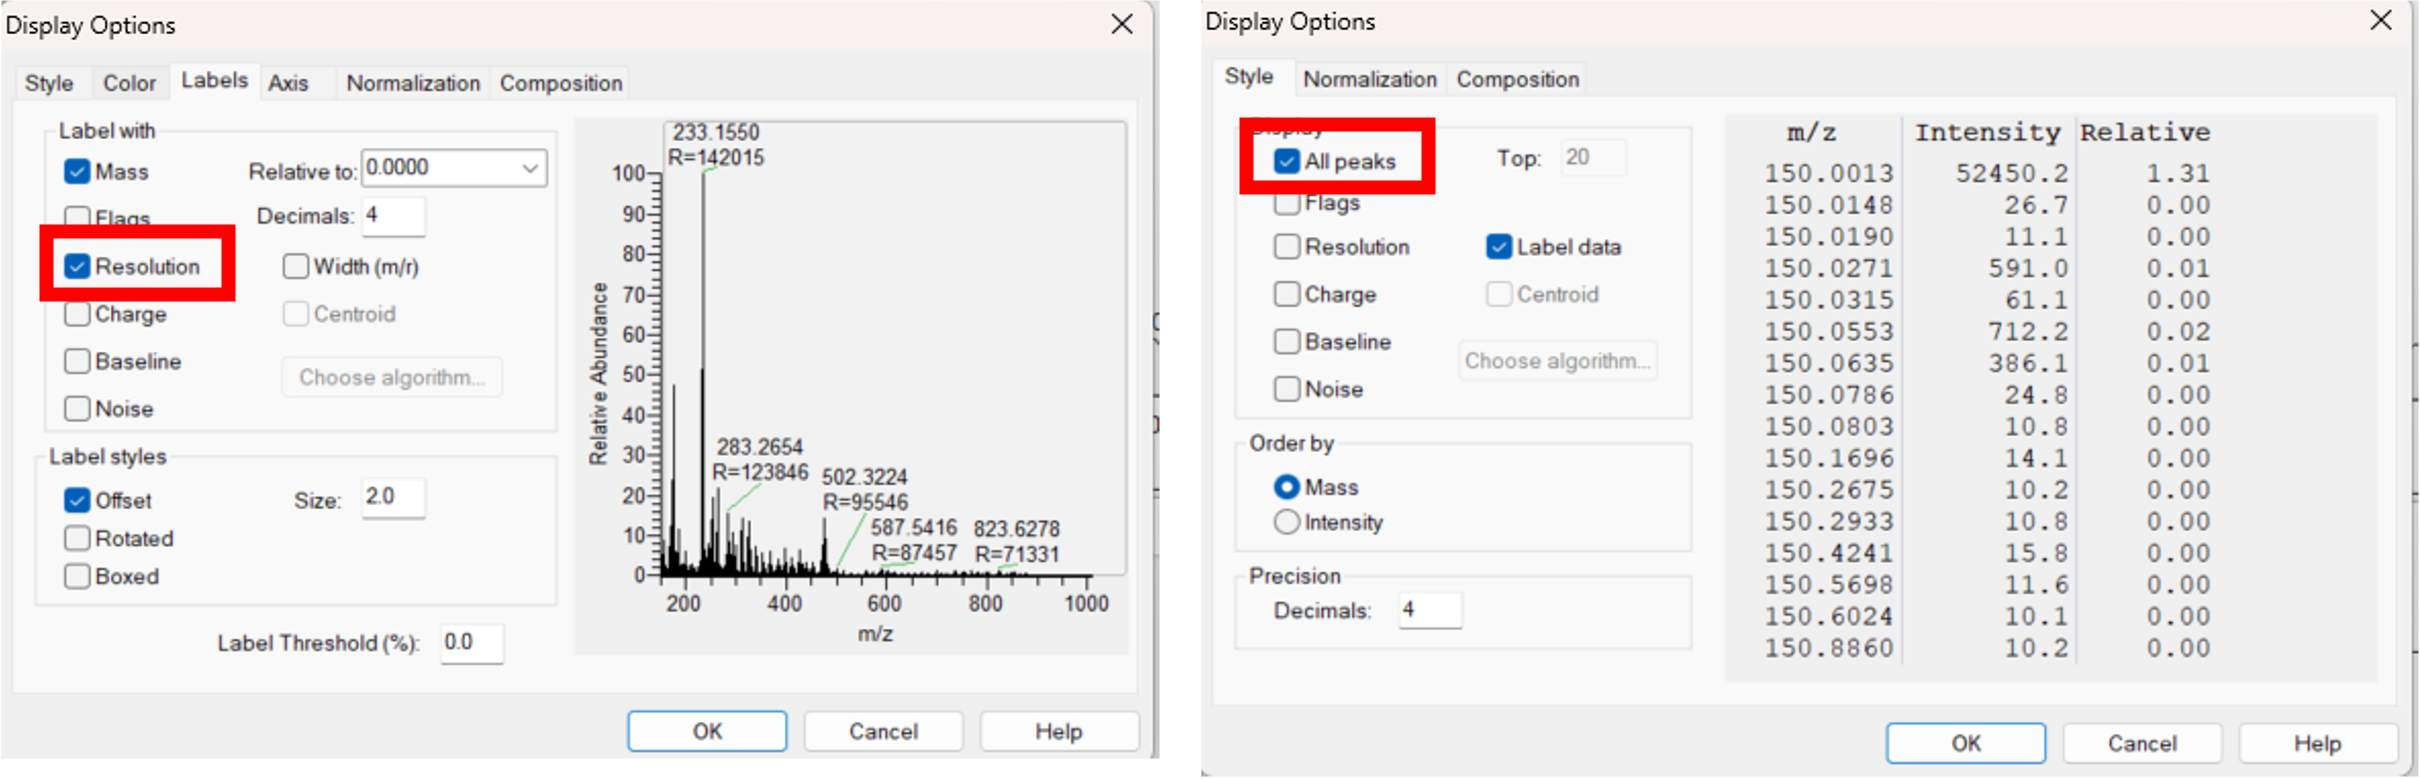 |
| Figure 2A. Guide to enable the export of the resolution. |
 |
| Figure 2B. Guide to enable the export of all peaks. |
 |
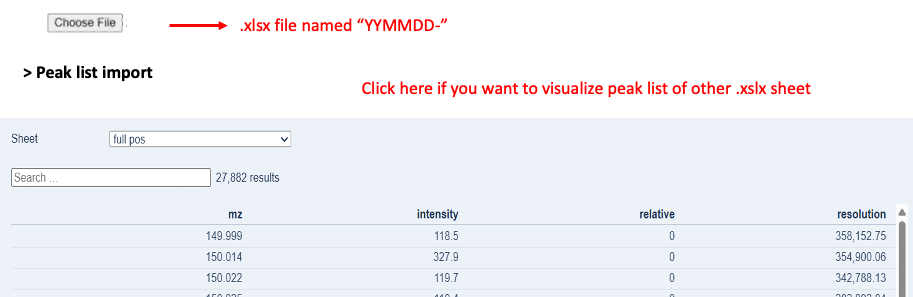
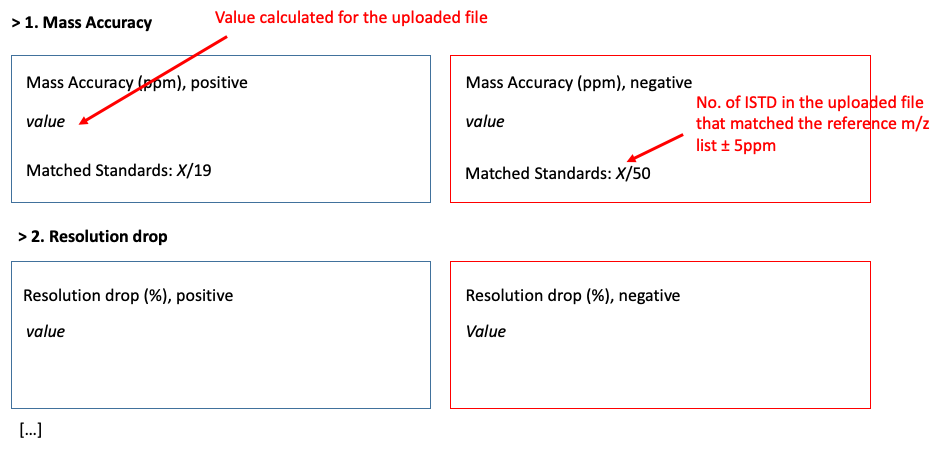
| Figure 2C. Example of an import file needed for the QC Shotgun software. Highlighted in red are the important details to consider for the correct use of the software. |


| Parameter |
Positive/Negative ion mode |
| Mass Accuracy |
± 0-1.5 ppm |
| Resolution drop |
15-20% |
| Isotopic Concordance |
95-100% |
| Class Response |
1-10 avg RSD |
| In-source Fragmentation |
<0.1 – 5% |
| Sensitivity |
5-25% |
| MS2 Fragmentation |
0-2 |
Contacts
Dr. Silvia Radrezza, radrezza@mpi-cbg.de